Metric Explorer
Enterprise Tool • Data Visualization
Metric Explorer is an internal tool designed to track key business metric performance and decompose metric change to locate the problem area.
! Important: data in this page is for illustration purpose only and doesn't represent any real business numbers.
time
2019
client
Uber
role
Lead Designer

data in this page is for illustration purpose only and doesn't represent any real business numbers.
Project Summary
Metric Explorer is a new application I designed for Uber's budgeting and performance tracking platform. As the solo designer, I brought the project from wireframes to final design and conducted 2 rounds of research within 6 weeks.
Background
Problem
While Uber has identified the few most critical business KPIs, our response time to diagnose significant decline in those metrics has historically been delayed between 2-6 weeks. The costs of delayed diagnosis in key metrics changes have resulted in enormous extra cost.
What caused this problem?
Lack of consistent monitoring framework
Monitoring and analysis is usually ad hoc, and different team members would grab different methods and tools
Discrepancy in
data source
Each team writes their own queries to build their own spreadsheets, resulting in difficulties in communication and lack of trust
Highly manual data collection and analysis
Spreadsheets from queries is the most used tool to collect and analyze data, which requires massive manual manipulation before getting insights
Product Definition
To solve the problems, we planned to add an application to Uber's budget and performance tracking platform. This application helps contextualize metric changes by identifying WHERE and WHY a particular metric change is happening.
Key Features
Change Decomposition
Anomaly Detection
Segment Time Series
Correlation Analysis

Research
Concept Validation
To accommodate a shorter project timeline, we decided to replace fundamental research with concept validation. I started sketching some ideas and turned them into low fidelity mockups. Then we visited 12 target users to collect feedback.
In our conversations with the users, we also discovered two different type of use cases. I summarized them into two personas.


Research Outcome
2 Personas

Jeremy
Strategy and Planning
Analyze data overtime to better understand what drives metric change

Anita
Incentive Allocation
Examine metrics correlations in top cities to see whether certain budget is impacting performance
Design Iteration
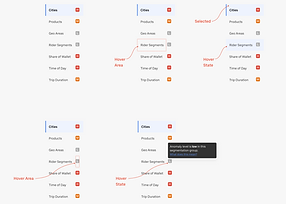
Explorations

Design Iteration
Final Outcome